It’s “Election Time” in the good ole USA, anything goes.
Gee - look at the massive downward trend in deaths after prohibition was repealed.
I think the title you are looking for is ‘War on Us by Cops’
Is there an equivalent graph for the whole population?
See that big spike around 1975? Well for an important cohort of voters, it will always be 1975. Darkies and dirty hippies are a threat that only the National Guard can contain. Look what they did to that nice President Nixon.
It’s primarily a war on the poor by cops. The wealthy aren’t involved very much, and whenever they do get involved, they are either on the side of the cops or else the cops lose that skirmish.
@Nelsie: Somebody pointed out the other day:
In the USA, twice as many white people are killed by cops as black people.
There are six times as many white people as black people.
Discrepancy! beep beep beep beep! How can this be?
There are only twice as many poor white people as poor black people.
Ah, discrepancy resolved.
The cops prey on the poor, and the poor are disproportionately non-white.
Unless we help all of the poor, regardless of race, we really won’t be helping anyone. The cops will still abuse the same number of people, they’ll just be paler.
Eh, I don’t doubt anything you’re saying here; I was just wondering if the police curve generally follows that of the general population, or falls more, or what.
Try this source:
Based on an estimated police force size of 1 million, this would mean that the black officers who were killed were almost twice as likely to be shot by cops than as cops.
Looks at replies, looks at own comments, wonders if his English is broken today and if it can be repaired.
What I’m wondering — and it’s fine you don’t have that info, because I admit I was being lazy — is what the plot of lethal shootings in the general population looks like in the same period. Not the curve of shootings by police, broken down by race or not — though that would be interesting, too — but all the shootings by the whole population of the USA, so I can compare the violence against cops against the general trend.
Ah, I see. Which makes my previous reply a non-sequitur… sorry!
I took a few shots at it with google images and couldn’t find a graph for the whole population that covers the same period. The numbers are definitely available from US government websites for a shorter, more recent period (although unfortunately the data is of low quality because the definition of what’s a reportable gun-related death varies over time and location) so I’m sure somebody’s plotted it, but I couldn’t find a reliable source. Here’s a possibly unreliable one.
Edit: Also, it’s worth noting that it’s unfair to compare gun deaths of armed persons to gun deaths of a largely unarmed populace; it would be slightly less unfair to compare to the total homicide rate, including knifings, defenestration, etc.

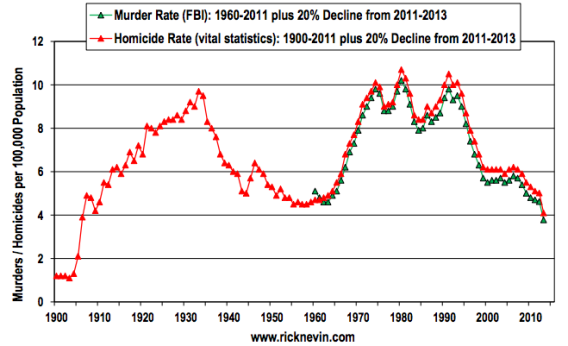
Here’s a mashup of a plot I found from Slate.com Ignore the vertical scale, but the years have been adjusted to coincide… make of it what you will.

[edit] Here’s the source http://www.slate.com/content/dam/slate/blogs/moneybox/2013/05/17/rick_nevin_murder_statistics_safest_year_ever/least%20murder%20ever.png.CROP.rectangle3-large.png
This is the main reason cops like to bust pot users. Real criminals ARE dangerous.
I saw a tweet by a cop recently that made me roll my eyes - it was something about how a police officer died every 48 hours or something to that effect. I mean, technically it was true - but only if you count heart attacks, car accidents on the way to work, etc. Even if you look at injuries sustained while on the job, the number of deaths caused by actually being murdered was still the minority share, whatever the weapon used… Police shoot unarmed black men at a much higher rate.
Cops are more likely to be killed in traffic related accidents. Many of those are one car crashes.
Soooo - drive safe.
According to Dept. of Labor stats, police officers are less likely to be killed on the job than are members of 12 other professions. Garbage collectors, for example, are about twice as likely to be killed on the job. Commercial fishing is nearly 10 times more dangerous than being a police officer:
And yes, you are less likely to be a victim of a homicide while working as a cop than you are while just being a regular non-cop person:
“About 40 percent of officers (30) who die in the line of duty are homicides, which would give police a murder rate of 3 per 100,000, compared with the average national murder rate for the general population of 5.6 per 100,000.”
http://www.washingtonmonthly.com/ten-miles-square/2015/01/how_dangerous_is_police_work_1053727.php
Yet this video is trending on Facebook at the moment.
I’ll give it to cops, they do seem to know something about diving, to borrow a term from soccer.
I am not going to argue whether it’s a myth or not, but I am going to point out that using per-capita numbers over a long time period can distort the view of an issue, unless adjusted for population increases over time as well.
In other words - if 100 cops are killed in a year when the population is 200 thousand (smaller numbers used to make the fraction more readable), and later 100 cops are killed in a year when the population is 300 thousand, the number of cops killed per year is 100, but the number of cops killed per capita is 1/2000 in the first year and 1/3000 in the second year.
People would use the per year numbers to show that the problem is “not going away” and would use the other two numbers to show that the problem is “getting better”.
The graph is per capita of 1 Million people. I would assume it would reflect the number of deaths per the population of that year. Other wise it would make the graph completely worthless and inaccurate. That is why you use - per capita stats, because the population variable differs widely. Try comparing the US to just about any country in stats would be ridiculous with out per capita stats because it is so much larger than nearly every other country.